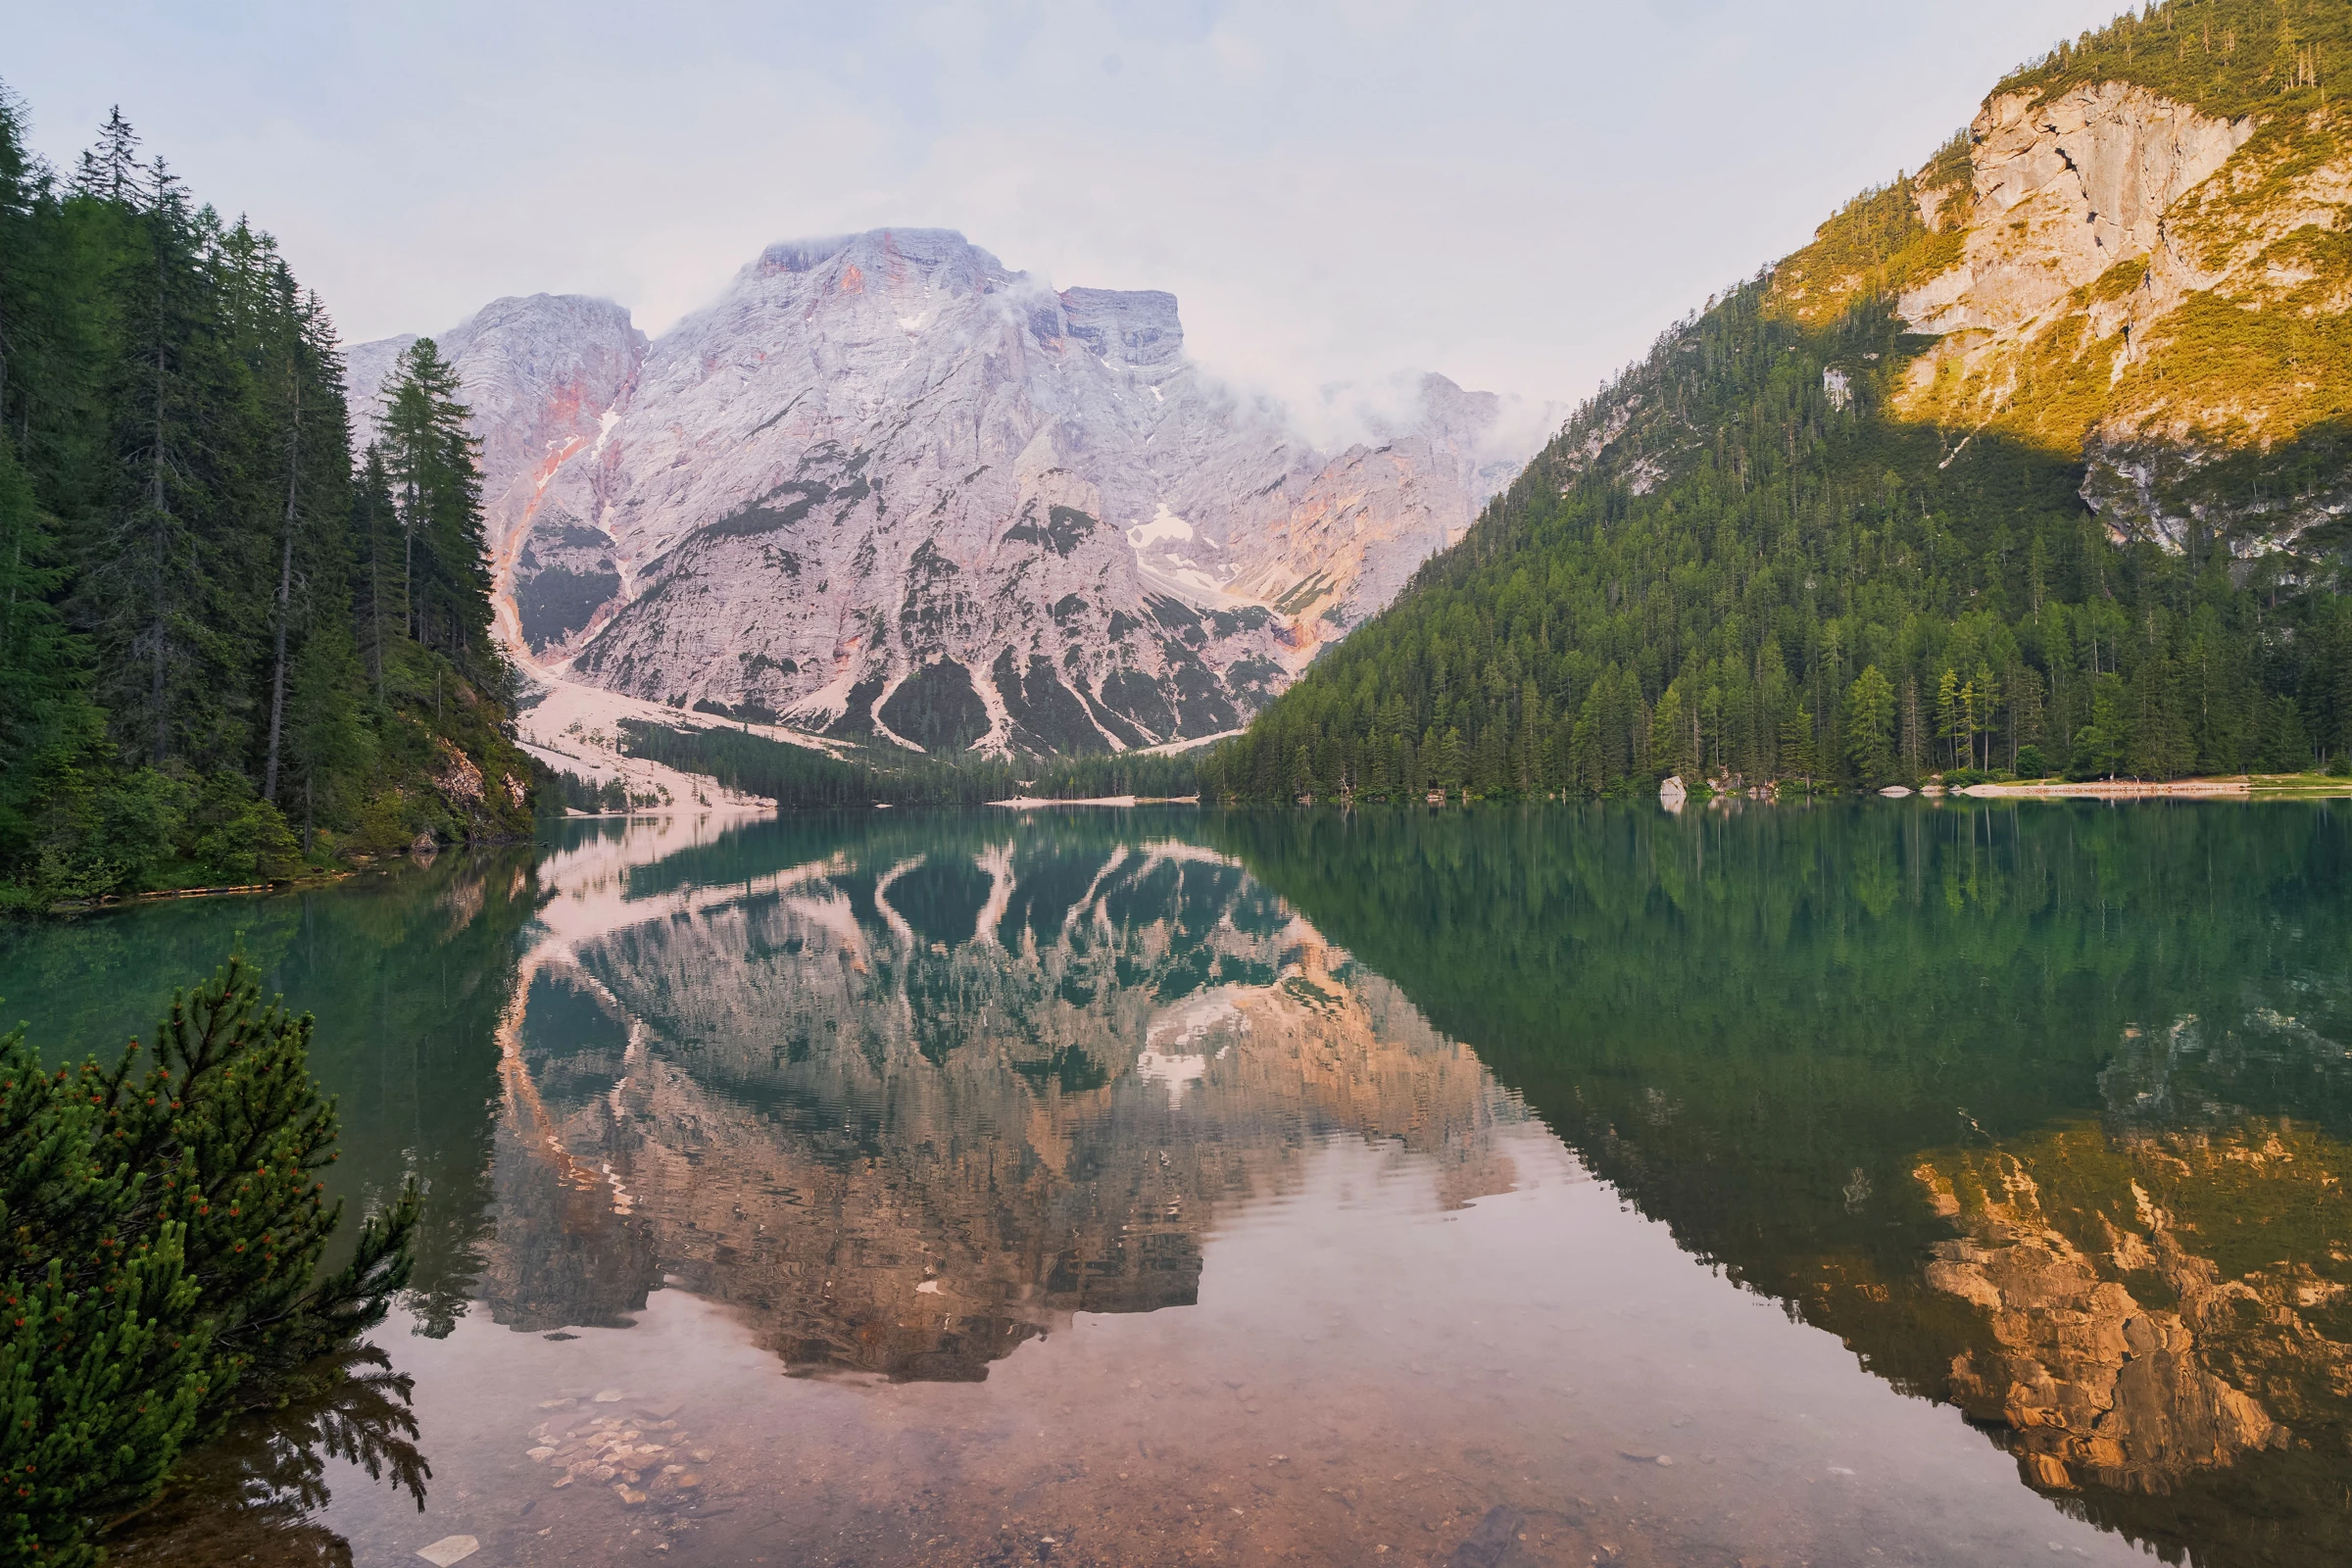
Mountain peaks reflected in an alpine lake in Italy

Sober Travel
Destinations 2027

Where could your next alcohol-free trip take you? Lantana Recovery compared activities, café options, drinking patterns and safety across US states and selected countries to identify the leading sober-travel destinations for 2027.

Explore the destinations

Key findings

Scores compare destinations within each group, not between groups.

Leading US state
Maine

Overall score81.35/100

Maine leads the US rankings. Its adult excessive-drinking rate is 16.5%, just below the 50-state median of 16.85% (2024; Tennessee 2023).

Leading selected country
Iceland

Overall score68.31/100

Iceland leads the country rankings. Alcohol consumption is 7.71 litres of pure alcohol per person age 15+, below the 40-country median of 9.54 litres (WHO, 2024).

Explore the destinations

Hover, focus or tap a destination. Open its full profile for all metrics.

US state mapUse Tab and arrow keys to explore destinations. Press Enter for a destination profile. Use the country lookup for small islands. Tap a destination for a summary, then open its full profile.

The US state rankings

US state rankings

Tips for an alcohol-free trip

A little planning leaves more room to enjoy being somewhere new.

01

Start with the daytime

Build a loose itinerary around walks, galleries, gardens or a class. Leave room for rest and spontaneous discoveries.

02

Check what is on the menu

Look up drink and food options in advance. Ask restaurants about alcohol-free choices rather than assuming every venue has them.

03

Set up your stay

Ask about the minibar before arrival, and choose accommodation close to the things you want to do.

04

Share your preferences

Let travel companions know what would make the trip enjoyable for you. Agree on a few activities everyone can look forward to.

05

Keep a backup plan

Save a nearby café, a quiet walking route and a way back to your accommodation. Plans can change without spoiling the day.

06

Stay connected, if you choose

Keep trusted contacts handy. If support is part of your routine, check how you can reach it while away, including across time zones.

Methodology

We compare 50 US states and 40 selected countries separately, using three equally weighted themes: social options, alcohol environment and safety. The 2027 edition draws on earlier source years, not forecasts or a measure of individual trip suitability.

Method and limitations
  • Scoring: Each indicator is scaled from 0 to 100 against the full group’s lowest and highest values. Lower drinking and crime figures score better; higher activity, café and travel-safety figures score better. Indicators are averaged within each theme, then the three themes are averaged equally. Ranks use full precision and shared competition ranks for ties. Missing values are not zero.
  • Inputs: US social options combine activity and café/snack densities; alcohol environment combines consumption, drinking-place density and excessive drinking; safety uses violent crime. Countries use activity and mapped café/similar densities, consumption and heavy episodic drinking, and Worlddata travel safety.
  • Years and units: US consumption is 2024 gallons of pure alcohol per person age 14+; countries use WHO’s 2024 common-year three-year average in litres per person age 15+. US excessive drinking covers binge or heavy drinking in adults: 49 states use 2024, Tennessee 2023 (15%). Country heavy episodic drinking means at least 60g on one occasion in the past 30 days, age-standardized, both sexes age 15+ including abstainers: 39 use 2020, Montenegro 2016. Venues, US population and crime use 2023 (population vintage 2025); country population uses 2024. Activities and OSM were collected November 2026; Worlddata is the 2026 edition.
  • Activity and venue limits: Six US and four country activity categories overlap, are not deduplicated and are not verified alcohol-free. Venues may serve alcohol. Country activity sums include rounded listing lower bounds, not unique attraction totals or estimated totals; 82 of 160 displayed inputs are rounded-plus, two pagination-only. Adding 500 or 990 per rounded cell is illustrative, not a known interval, ceiling or proof of robustness to uneven errors, changed weights or WHO uncertainty. Some original timestamps are missing and cached title years vary. OSM coverage depends on local mapping and tagging, not a complete business census. US employer venue counts exclude non-employers and do not capture all alcohol-serving venues.
  • Interpretation: Resident-based densities do not measure visitor exposure; averages hide local differences. Mixed observation years are not 2027 data. Countries were screened using Worlddata safety, also used in scoring, so this is not a worldwide ranking. Its 51-criteria composite includes health, crime, conflict and environmental risks; component years and full weights are unavailable. Historical WPR capture is unavailable; matching FBI rounded whole rates does not establish earlier transformations. Group choices, weights and uncertain inputs can change ranks. This is not a clinical assessment, safety guarantee or substitute for current travel advice.
  • Map: Alaska and Hawaii are repositioned insets; Alaska uses 0.35× mainland scale, Hawaii mainland scale. Unselected countries are neutral, not zero; borders are reference only. Use country lookup for small islands.
Sources